


01
Software Development
Digital products and production systems engineered around real business operations.
- Web Applications
- Business Platforms
- APIs & Integrations
We design data, reporting and analytics systems that connect operational information, make performance visible and help teams understand what is happening across the business.
What We Deliver
We build reporting and analytics experiences that make important information easier to access, understand and use across operational and management workflows.
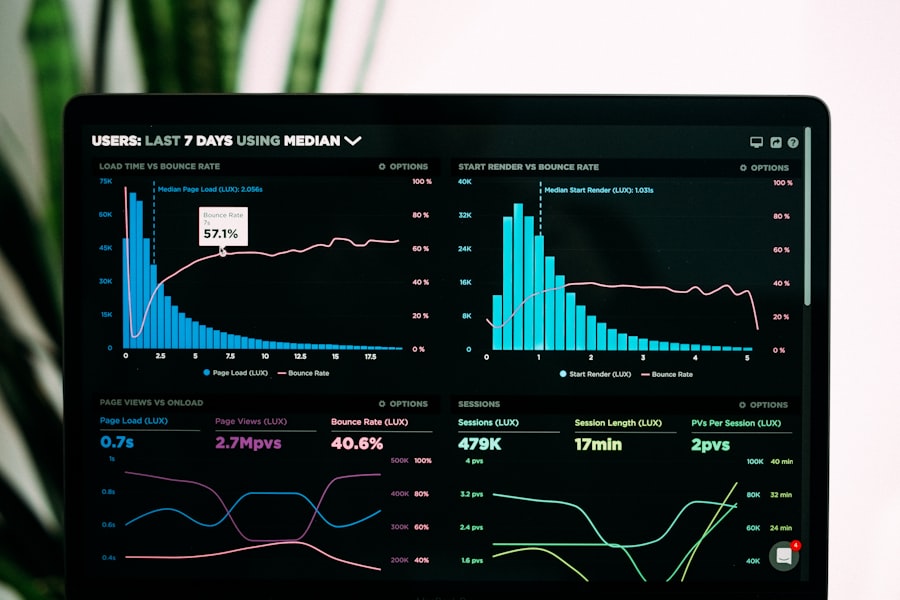
Digital platforms that bring together business metrics, reporting, exploration and operational insight within one structured analytics experience.
Focused dashboards that make strategic and operational performance visible without forcing decision-makers to navigate raw data.
Structured reporting workflows that turn recurring operational information into consistent, accessible and maintainable reports.
Connections between applications, databases, APIs and files that bring important business information into a usable data flow.
Metric systems that define, calculate and present the indicators teams use to understand targets, trends and operational performance.
Data products that connect metrics, context and investigation workflows so people can move from information to a practical decision.
Connected data and decision systems that make business information useful and visible.
Data Engineering Capability
Useful analytics depends on the engineering work behind the interface: connected sources, reliable transformations, shared definitions and reporting designed around real decisions.
Data structures, flows and storage decisions designed around source systems, reporting requirements and operational use.
Reliable movement of information between applications, APIs, databases and scheduled processes with clear ownership and cadence.
Validation, normalization and transformation processes that make source information more consistent before it reaches reporting.
Shared definitions for KPIs, metrics, dimensions and business logic so reporting reflects consistent operational meaning.
Accessible dashboards, reports and exploration views that present the right level of information for each audience and task.
Analytics workflows that help teams interpret performance, investigate change and connect information to practical action.
Related Solutions
We use minimal local storage to run your cart and keep the site working — no tracking or advertising cookies. See our Cookie Policy.